

WISA Webinar – 16 July 2020: How to turn your Water Quality Data into Water Management Knowledge
This WISA Members webinar was presented by Carin Bosman on 16 July 2020′, and focussed on turning your water quality data into water management knowledge, .
Overview
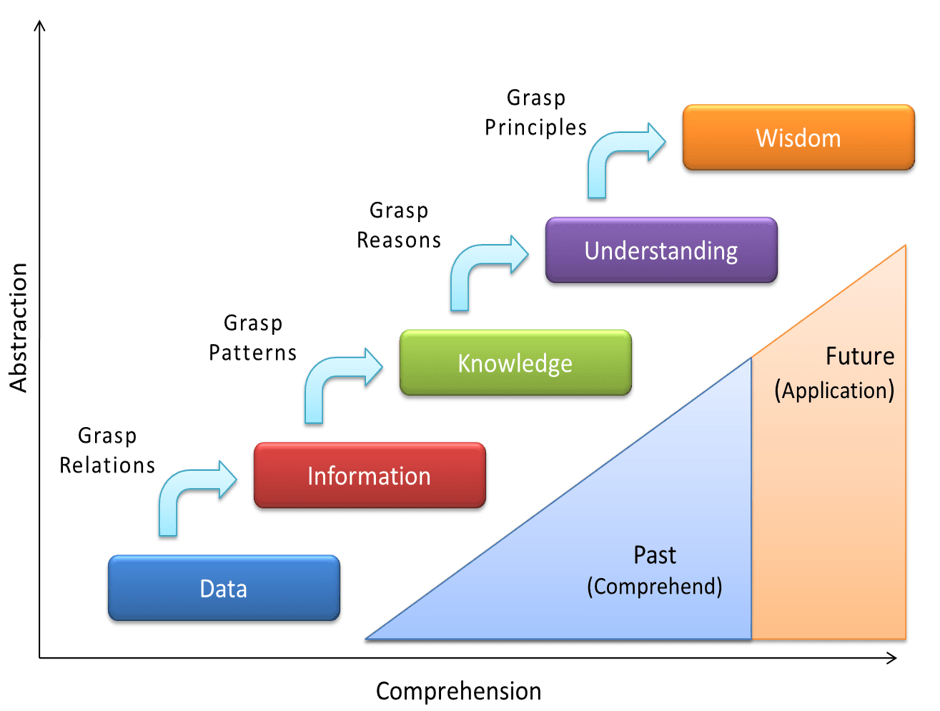
Most mines, industries and municipalities take regular samples of surface and groundwater, and receive the results of the laboratory analysis in electronic format (either excel spreadsheets or pdfs). These results, obtained at great cost, are however rarely properly interpreted, due to the fact that the visualisation of the data into graphical format is such a time-consuming process. The data collected however contains extremely valuable information when it is presented in a visual format, and can (and should!) be used to take water management and other decisions.
This webinar demonstrates how the process of turning water quality monitoring data into management knowledge works, and illustrates by way of practical examples what the type of knowledge is that can be gained from the proper visualisation and interpretation of water quality monitoring data. The video includes the questions and discussion of issues that participants are dealing with, including aspects relating to compliance specifications.
Programme
- Introduction – what is water quality monitoring and why do we do it?
- The process of water quality monitoring – from field sampling to data storage and interpretation of results
- Pitfalls in water quality monitoring programme implementation
- Statutory limit values and compliance specifications (including why it is scientifically incorrect to compare groundwater samples to drinking water standards)
- Management decision making based on the proper interpretation of water quality monitoring results
- Selecting the correct graphical visualisation for your water monitoring data (time-series graphs, box-and-whisker plots, Maucha diagrams, stiff diagrams, piper and Durov plots, and specialised visualisations such as Ficklin diagrams)
- Digitalisation and automation of the graphical representation of water monitoring results (WRC-funded Leguaan® software as a service)
- Questions and answer session: issues relating to the interpretation of water monitoring data
Watch it now:


Want to know more about Our LEGUAAN SaaS?


